
Inventory turnover ratio measures how many times you sell through and replace your inventory over a given period. It’s one of the clearest signals of whether your purchasing decisions match what’s actually selling — a low ratio means cash tied up in stock that isn’t moving; a high ratio (up to a point) means you’re buying close to what customers actually want. This guide covers the formula, what counts as a healthy ratio, and specific ways to improve it.
Key Takeaways
- Inventory turnover ratio = Cost of Goods Sold ÷ Average Inventory Value, over a set period.
- Most retail businesses aim for a ratio between 5 and 10 — but the right number varies significantly by category (perishables turn much faster than furniture, for example).
- A low ratio usually indicates overstocking or slow-moving inventory; an extremely high ratio may indicate understocking and a risk of stockouts.
- Improving your ratio comes down to three levers: better purchasing decisions, moving slow stock deliberately, and having real-time visibility into what’s actually selling.
- This is a related but different metric from sell-through rate — see the Sell-Through Rate guide for that comparison in depth.
1. What Is Inventory Turnover Ratio?
Inventory turnover ratio measures how many times your business sells and replaces its inventory during a specific period — usually a year, sometimes a quarter or month for faster-moving categories. It’s a core efficiency metric because it ties together purchasing, sales velocity, and cash flow into a single number: how well what you’re buying aligns with what customers are actually buying.

2. How to Calculate It
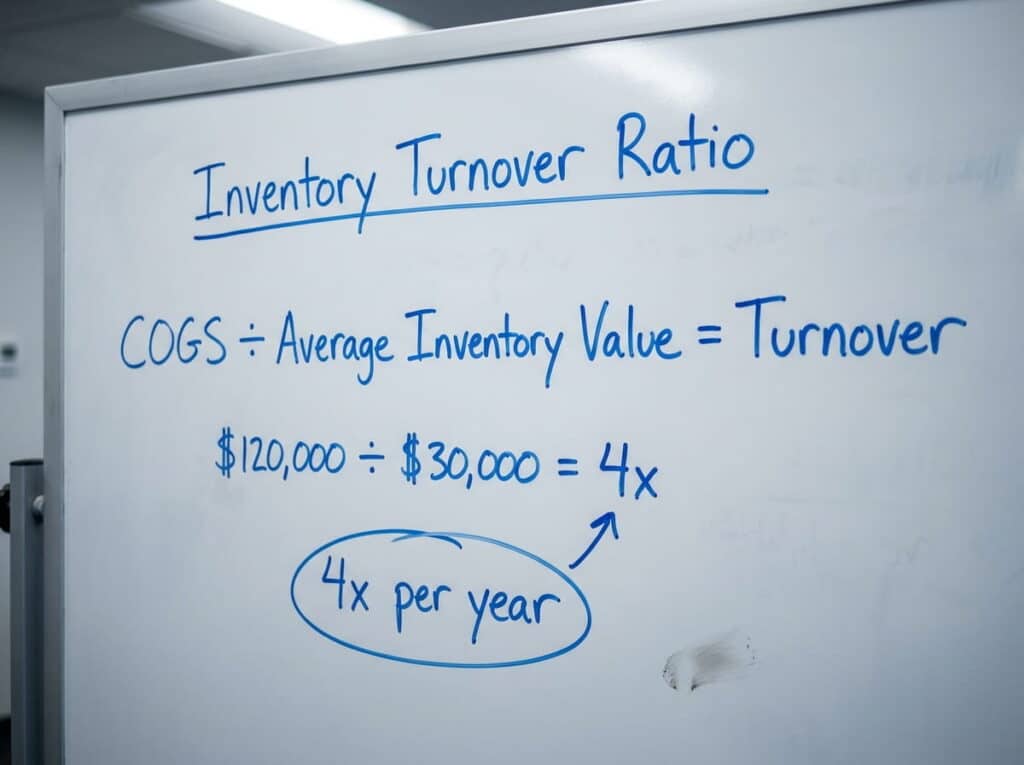
The standard formula:
Inventory Turnover Ratio = Cost of Goods Sold (COGS) ÷ Average Inventory Value
Average inventory value is typically (Beginning Inventory + Ending Inventory) ÷ 2 for the period you’re measuring. For example, if your COGS for the year was $500,000 and your average inventory value was $75,000, your turnover ratio is 6.7 — meaning you sold through and replaced your inventory roughly 6.7 times that year.
Corporate Finance Institute — “Inventory Turnover – Formula, Calculation & Examples”
3. What’s a Good Inventory Turnover Ratio?
For most retail categories, a ratio between 5 and 10 is considered healthy — selling through and restocking every one to two months. But the right number depends heavily on what you sell: perishable or fast-fashion categories often run much higher, while furniture, jewelry, or specialty hardware naturally turn over more slowly without that being a problem. There’s no single “good” number that applies to every retail vertical — the more useful comparison is your own ratio over time, and against others in your specific category.

4. Why a Low (or Too-High) Ratio Is a Problem
A low ratio usually means cash tied up in inventory that isn’t moving — the same core issue behind excess inventory and dead stock (see the Excess Inventory and Dead Stock guides for what happens when this goes unaddressed). An unusually high ratio, on the other hand, can signal the opposite problem: understocking, which risks stockouts and lost sales even though the inventory numbers look “efficient” on paper. The goal isn’t the highest possible number — it’s the right number for your category, held steady.

5. How to Improve Your Inventory Turnover Ratio
See what’s actually selling, in real time.
Real-Time Reporting and Dashboards show which items are moving and which aren’t, so purchasing decisions are based on actual sales data instead of assumptions carried over from last season.
Buy closer to demand.
PO Receiving and purchasing tools that show what’s already on order help avoid over-ordering categories that are already turning slowly.
Move slow stock deliberately, not by accident.
Promotions and targeted discounts on slow-moving items convert dead weight into cash instead of letting it sit until it’s written off.
Balance inventory across locations instead of over-ordering everywhere.
Stock Transfer lets a multi-location retailer move slow-moving stock to a location where it’s actually selling, instead of buying more of the same item for a store where it’s stalled.

6. How Seasonality Affects Turnover
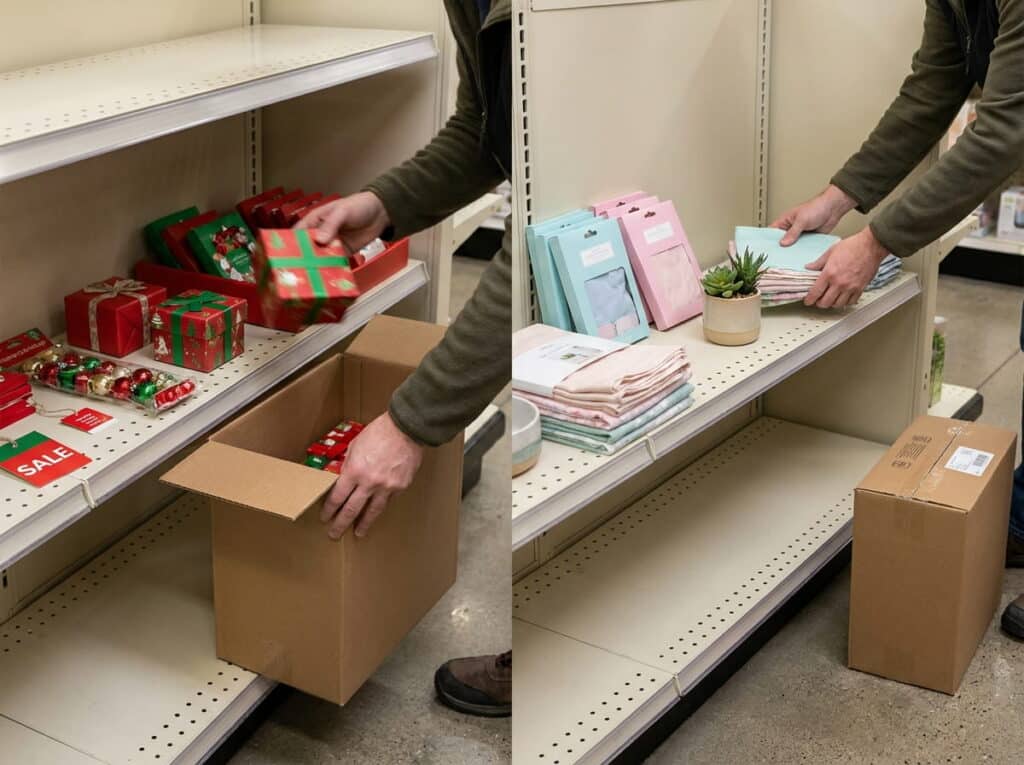
Turnover ratio naturally swings across the year for most retail categories — holiday-driven inventory turns fast in November and December and slower the rest of the year; outdoor and seasonal goods follow the same pattern in reverse. Measuring turnover ratio on an annual basis can hide these swings; checking it quarterly or monthly for seasonal categories gives a more accurate read on whether a slow period is normal seasonality or an actual purchasing problem.
7. Common Questions
What’s considered a good inventory turnover ratio?
Most retailers aim for 5-10 annually, but the right number depends heavily on your specific product category.
What does a low inventory turnover ratio mean?
Usually overstocking, slow-moving products, or purchasing that isn’t matched to actual demand.
How is this different from sell-through rate?
They’re related but distinct — sell-through rate measures a specific batch of received inventory sold within a period; turnover ratio measures overall inventory efficiency across a full period. See the Sell-Through Rate guide for the full comparison.
How often should I calculate my turnover ratio?
Annually for a general health check, but quarterly or monthly if your category is seasonal.
Closing
Tracking and improving your inventory turnover ratio comes down to having the right visibility into what’s selling and the tools to act on it — from real-time reporting to moving stock where it’s actually needed.